Showing posts with label tools. Show all posts

Tuesday, February 16, 2016

Correlating Promoters Part I

It has been a while since I've look at penny stock promoters so I figured I'd get back into the game by tracking the performance of the various promoters. Back in the day, there were a few big name promoters like Awesome Penny Stocks, Best Damn Penny Stocks, etc. I know many of those guys fizzled over time and became less effective as their notoriety increased.

To see who (if anyone) has taken over this niche with effective stock promotion, I'll be starting from scratch, learning who the players are. If you're new to this site and penny stock trading, I should emphasize now that the stocks being promoted by newsletters are almost definitely horrible companies and should be treated as such. Do not believe anything a newsletter tells you because they are being paid by someone to say it. Read the disclaimers in each email!

Why is this information useful?


There are so many promoters that come and go, it would be a waste of time to track them all. Most of them don't create enough volatility to make trading their tickers worth it. By tracking the performance of various promoters, we can get a handle on who we should pay attention to-- and more importantly, who not to waste our time with.

Ideally we want to find promoters that are able to catalyze significant price moves that will more for good short sells. In all likelihood, a stock promoted by a newsletter is trash and any upward movement will result in future predictable downward movement that we can profit from. We might also consider buying before a run-up but considering the current market conditions, I really, really doubt that will be a viable strategy.

Gather the newsletters


The first step is to gather all the newsletters you can. A simple and effective way to do this is to just search "penny stocks" on google. Click on all those promoted links on the top and on the side that are promising you the best stock picks. You'll want a separate email account for this since we are literally gathering spam which you won't want in the same email account you use for other important correspondence.

One helpful tip about email addresses is that you can amend labels to the email address by using a plus sign. For example, if your email address is myemail@gmail.com, you can provide myemail+whateverlabelyouwant@gmail.com and it will still be considered a perfectly valid email address.
We can use this to our advantage by giving each newsletter it's own distinct label. So when I'm signing up for the newsletter of http://moneymorningresearch.com/, I can give them the email address myemail+moneymorning@gmail.com. This way, if a newsletter shares our email address with any other groups, we can see who we originally gave the email to since it will still have that label with it. In the future I'll post some pictures to illustrate how this works.

Organize the newsletters


Each promoter operates several different stock promotion websites so our goal is to figure out which promoters own which sites. In the past, this was often as easy as reading the bottom of each email to see the name of the parent company. This doesn't seem to be the case anymore which is partly what spurred me to write this guide. I'll try to do some of this work so that others don't have to.

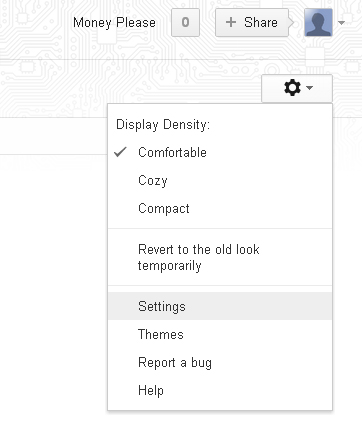
Gmail makes this process easier by allowing us to create filters and labels for each email sender. When you receive an email you'd like to create a filter for, click the drop-down menu beside the reply button and choose "Filter messages like this".
You'll be given the option to make the filter more specific if you'd like. For our purposes, the default will work fine. Click "Create filter with this search" to continue.
The next dialog asks what you'd like to do with the message. Check the box next to "Apply the label" and then select "New label...". Give your label a name that reflects the promoter who sent the email. Since we don't yet know which promoters own which sites, you'll need to create a new label for each newsletter site you subscribe to.
Lastly, we can assign our new labels with colors. This allows us to glance at our inbox and immediately see which promoters are promoting which stocks. This will become more useful as we whittle down our labels to only the most influential promoters.

I'll come back to this and expand on how to use this information in a future post. So keep checking back and in the meantime trade cautiously!

Thursday, April 16, 2015

Review: Robinhood

I’ve been using the Robinhood app for a few months now and have executed a small handful of trades. There is much to like about the app as the aesthetics of the GUI have been carefully implemented so as to achieve a very neat streamlined feel. There is certainly no danger of cluttered data views overloading you with information as some other apps seem to do.


Unfortunately, sleek and sexy interfaces are not the qualities I value most in my trading applications. Relevant, concise, and consolidated data views in conjunction with intuitive interfaces catered to speed are the qualities that will help you make money with your trades. While using the app there were too many times I found myself stumbling through views looking for my order history or even my open positions. It’s a special kind of frustration to be stuck in a trade for longer than you’d like because you have to waste time figuring out how to get out.

It also worried me that being offered only a single point of access to my account, the app, I could become stuck in trades if my device froze up, broke, or otherwise became unavailable for use. There was no backup computer-based application to turn to.

Before I make myself seem too much like a bumbling old geezer struggling to grasp the concept of technology, I should say that it was actually the simplicity of the app that caused me the most problems. The linearly nested structure of navigation made me feel as though I were sitting at someone else’s computer attempting to find files hidden within arbitrarily named folders. I would have preferred a navigational scheme that branched out from a central point so getting to what you’re looking for required fewer clicks. Don’t fear the clutter Robinhood, we need speed!

Worse still, I would never have felt confident basing a trade solely on the chart views offered within the app itself. It simply wasn’t robust enough to allow me to make an informed decision. And by forcing the use of secondary software, it really limited the usefulness of the app.

So at this point the free trades were the only remaining attractive quality but what demographic does this serve? Serious traders who place many trades might benefit the most from a lack of fees but would scoff at the limited set of features and deprioritizetion of speed. And would the casual trader who only places a few trades a year actually be saving money if they made those trades using the limited information offered by the app? My guess would be that a more developed, feature-rich application is worth the cost of trading fees.


If Robinhood has any hope of success, they need to expand their offerings to entice more people. Have some sort of backup to trade with if the app isn’t working (even if it's just another android app). Offer margin accounts or an API to extend its usefulness. There is hope, but at this point I can’t offer any enthusiastic endorsements for Robinhood.

Thursday, November 28, 2013

Upgrade Your Bathroom Experience

I'm going to propose an idea here. Sure, you may think it's a little ridiculous at first but hear me out.

Traders are constantly at risk of being betrayed by their bodies. Say you're watching a stock setting itself up for some perfect technical indicator. You wait patiently for the perfect moment to pull the trigger. Then you realize you really have to pee. Do you miss the perfect opportunity? Or worse still, do you pull the trigger and run off, hoping the stock will cooperate with you and continue with the trend you expected. Hundreds or thousands of dollars could be on the line. That's one expensive pee break. One can only imagine the sort of devastation if you had to go number two.

How about we solve that problem? Technological solutions are already entirely pervasive in our modern world. It's about time we make the transition to dedicated bathroom computing.


I don't think you could find a better choice than the Acer Aspire E1-531-4665.With 2.2GHz of processing speed and 4GB of RAM, you'll be placing trades and checking email faster than you can say 2-ply.

Wednesday, September 11, 2013

FAQ: I Have A Small Account, Where/How Should I Trade It?

I get this sort of question a lot from people looking for advice on how to get started with a smaller account. Now it would probably be in my best interest to do what everyone else on Wall Street seems to do and feed you some investing strategy while encouraging you to come back to my blog for future tips and tricks. That being said, I created this blog to help people and the best way to do that is this:

Don't trade with less than $10,000!

While it's certainly possible to make money with smaller accounts, I have to strongly discourage it because the odds are simply stacked against you and trading is all about odds. 

I'll explain further.

For small accounts, the fees charged by brokerages represent a larger percentage of your worth than they would for a big account. That translates into requiring a larger percentage gain from your stock trades in order to stay profitable. Here's an example: Small account holder Average Joe buys 800 shares of XYZ at $2.50 a share. Millionaire Max buys 7000 shares at the same price. Within a short time, the price rises to $2.60 for a 4% gain on your investment. Not bad! That's a profit of $80 for Joe and $700 for Max. Unfortunately for Joe his broker charges $7.50 per trade, and $30 dollars a month for software and data feeds. which represents 56.25% of his profit! Those same fees represent only 6.43% of Max's gain.

To compensate for this problem, most novice traders will hold their positions longer, hoping for big percentage gains. Unfortunately, trading isn't that easy and most likely holding longer won't get you any more gains. In fact, you may end up in the red on that trade since more time in the trade equals more risk. In that scenario, all the fees stay constant AND you're going to lose money on that trade. This means that your next trade would need to net you even more money to make you profitable. Thus, your chances of success become less and less likely. You should be starting to understand now that all the little problems traders face are magnified by small accounts. And chances are, since you're new, you're going to be making more mistakes than quality trades.

Small accounts are also at greater risk of going bust than large accounts. You should never invest your entire account into a single trade because you can never be sure if you're right. If trading were that easy, everyone would be making money but the sad fact is that most people lose money because most people don't read this blog. Good traders only risk around 10% of their account on any one trade. If you have less than ten-thousand dollars though, that leaves you with a very small amount to trade and compounds the issue illustrated above. If you go all-in on every trade, you're probably just going to bleed your account into oblivion.

"But hey! I'm making millions on my paper trading account!"

Practicing on paper trading accounts does little more than acquaint you with a particular broker's software. Many of the variables that make trading challenging are diminished or removed in the paper trading world which can mislead you into thinking you're a bit more skilled than you actually are. One big reason is that paper trading is mentally distinct from actual trading because it doesn't punish mistakes in a meaningful way. Introducing the risk of losing your real-life hard-earned money is likely to influence the way you trade. Most notably your ability to accept a loss and get out of a bad trade rather than holding and hoping.

Furthermore, and much less obviously, paper trading diminishes the influence of liquidity and your role in that liquidity (if you want some clarification on liquidity and other basic terms, click here). In the real world, your trade order can influence the price of the stock. While this wouldn't be noticeable if you were trading GOOG, small accounts are probably going to be trading small cheap stocks which are much less liquid. These stocks are going to behave in ways that may not have been apparent in the paper world.

Shorting in particular is not well represented by paper trading. The biggest factor for this trading strategy is the availability of shares. The only way you're going to get an accurate sense of this issue is by actually trading. You have to short early (which is much higher risk) in the real world before the shares become unavailable to borrow. Once the odds are obviously in your favor and the risk is lower, the stock is probably not going to be available to borrow because everyone wants them at that point! As such, these borrows are often only available to large account holders who can manage these higher risk trades. Large losses don't put them out of the game. Shorting also involves borrow fees and fees, as I explained earlier, are bad for the small account holder.

Thursday, April 18, 2013

Beginner's Guide To Trading Penny Stocks: Part III

Which stocks do I sell?

In many ways, you figure out which stocks to sell using the same methods as figuring out when to buy. You evaluate the price action, fundamentals, level 2, and news/hype.

So say you've bought some shares around 1 dollar because you decided that was a good support level. At this point you should have an idea of how you want to exit that trade based on price action. It would be a good idea to sell your shares if the stock falls below 1 dollar because that indicates the stock is weak or bearish. The closer you buy to that one dollar mark, the less money you will lose should you have to sell out when it breaks below that level.

Hopefully though the stock will go up. There may have been some positive news in the recent past that you think people will take notice of and create more buyers. Their fundamentals may also be strong which gave you reason to believe that the stock deserves to be trading higher (remember though that price action overrides fundamentals. There are plenty of stocks higher or lower than they should based purely on fundamentals). Another good reason to buy could be strong support at the 1 dollar level in your level 2, which further protects you from potential losses as well as indicating buying interest.

In the CLDS example, and presuming the stock continued up, it would be a good idea to consider selling around the $1.40 level because we can see that it is a resistance point. It may go above that, but it may not. And since it didn't go above that level before, you have slightly more reason to believe that it won't so it makes sense to sell there. If you hold your position too long waiting to see if it breaks above that level, you risk missing your opportunity to get out with a profit. Once it does fail to break above a resistance level, other traders will also want to sell their positions and the price will fall.

Once you've comfortable trading, sell points can also mark good positions to enter into a short position. The idea is that you sell the stock before you buy it, thus borrowing it from your broker, then you buy it back later. To do this profitably, you sell high and buy low. Generally shorting is considered more risky though so unless you're sure you understand the mechanics of it, you should first try it out using a paper trading account if your broker offers one.

So how do I find stocks to trade?

...to be continued...

Saturday, April 6, 2013

Beginner's Guide To Trading Penny Stocks: Part II

Which stocks do I buy?

You'll want to decide which stocks to buy based on many factors. The elements you choose to favor when deciding if something will make a good trade becomes your trading style. The two most influential things to consider though are the technicals and the fundamentals. Technical analysis tends to be more important for penny stocks so we'll talk about that first.

What is technical analysis?

Technical analysis concentrates on the price action of the stock in an attempt to identify strategic buy and sell points. In other words, you look at how the stock has traded in the past to predict how it will trade in the near future.

This chart is choked by a slew of technical indicators (those straight lines moving across the graph). Each one purports to tell you something different about the stock in question. Luckily for you, most of them aren't worth learning when it comes to analyzing penny stocks.

Basic technical analysis, and what I rely on most when determining my trades, examines just two things: support and resistance.

In this graph, I've drawn lines to mark the areas of support and resistance. They are determined simply by where the stock has been. We can see that the stock hit the one dollar mark twice in the past then bounced back, thus establishing the one dollar area as support. If the stock were to bounce off the one dollar mark again, that level of support would be strengthened. The more times it hits a support level and fails to break below that level, the stronger it becomes.

The same is true of the resistance level. We can see that the stock hit the $1.43ish level twice, then fell back down. We can then say that this stock price is a resistance level. You can also see that the price action tended to hang around the 1.40 level a bit. This is mostly because it's human nature to favor nice round numbers so people set their trades there more often than they would at some other arbitrary number like say $1.37.

So how do you use this new information? Basically you use these levels to maximize your potential gains, and minimize your potential risk. Continuing with the example of the CLDS chart above, you wouldn't want to trade it at it's current level of $1.25 because it's mid-range of it's support and resistance levels. There's no reliable way to predict if it will go up or down from this point so you're better off not trading it. On the other hand, if the stock fell back to the one dollar level you could consider buying because that level offers support. It also allows you to create a logical trading plan before you even enter into the trade. Your plan might be something like, "I'll buy this stock at $1 and look to sell it at $1.40 where there is resistance. If the stock falls below $1, the support level, I will immediately close my position for a small loss."

The reason why your plan accounts for the breaking of support below one dollar is because the breaking, or collapse of support, is a strong bearish sign. It indicates that the stock will go down so you won't want to have a long position in that stock. A long position means that you've bought the stock in the hopes that it will rise in price.

Which stocks do I sell?

Thursday, March 28, 2013

@lx21 Tweets & Results

Tracking @lx21's tweeted predictions...

$ABKFQ tweet advising short position:


Beginner's Guide To Trading Penny Stocks: Part I

Penny stocks are an attractive jumping off point for people who have never traded before because they're cheap. You can purchase a large number of shares with only a little bit of money, which means you stand to gain an excellent return if that stock price rises. While these reasons are certainly valid, we need to explore a little deeper to really understand how a novice trader should be making their investments.

What exactly is a penny stock?

Holy crap. You can buy so much stock!
Browsing the internet will uncover several definitions. The term basically just refers to a cheap stock. Personally, I consider stocks less than $5 a share but greater than around 30 cents to be a penny stock. Stocks under 30 cents might be more appropriately termed sub-penny stocks which should be avoided by the novice trader. Penny stocks are also typically less well known so you might not consider a big name company trading under $5 dollars to be a true penny stock.

Stocks, including penny stocks, are traded over exchanges. You've probably heard of some of the major ones such as the NASDAQ. Each exchange has its own requirements that a company must meet for their stock to be traded on that exchange. Since exchanges like the NASDAQ have more strict regulations concerning what companies must disclose and report to investors and the SEC, you won't see many penny stocks trading there. Instead, most penny stocks appear on the Over-The-Counter (OTC) markets.

Characteristically, penny stocks are more illiquid than other stocks. Liquidity, in this case, refers to the stocks volume, which is just another way of saying how many of that stocks shares were traded. A stock with high volume is basically just trading a lot. In order to be liquid though, that volume must be consistent throughout the trading day. Liquidity is important because it determines how easily you can buy and sell that stock.


Never trade a stock with a chart like this
The chart above shows a penny stock with very low trading volume, meaning it is also very illiquid. You may run into charts like this because they often see large percentage changes which create a tempting illusion to new traders. A stock that is up 250% in a single day might make you salivate when considering how much money you can make if you had just bought in the morning. You start to see the illusion for what it is though when you consider all the factors. The biggest problem is that low volume, illiquid stocks, rarely show a clear trend. They may gain 50% or more from a single trade then 30 minutes later be down 100%. Basically, they're terribly unpredictable and you should just train yourself to recognize which stock charts to ignore.

A trend can be more easily seen here
This chart shows a stock trading with extremely high volume, making it liquid. As you can see, it's much easier to see a pattern which is really the key to successful trading. You can use the pattern of the trading to better predict how the stock may behave in the future and plan you're trades accordingly. We'll go into that more later though.

Beyond just looking at a chart, you can use the more quantitative analysis of a stock's dollar volume. Dollar volume shows the relationship between volume and stock price, which provides a more accurate picture of how liquid a stock is. For instance, a stock that trades 20 million shares in a single day might seem like a high volume stock with good liquidity, but if that stock is only valued at $0.0001 a share, it only traded $2000 dollars worth of stock which is pretty much nothing. Dollar volume is usually shown when looking at stock quotes but you can give yourself a rough idea of it by simply multiplying the days total volume by the stocks current stock price (although it would be more accurate to use the stocks average price for that day). A stock that trades a few hundred thousand dollars a day or more is generally going to be liquid enough to consider trading.


Which stocks do I buy?

Thursday, March 21, 2013

Audio Alert When Shortable

Since I use Interactive Brokers, the main method of determining if a stock is shortable has been looking at a colored column. Bright green means there are at least 1000 shares available to short, dark green means you can sell short but there are currently no shares available to do so. Lastly, red means the security is unavailable to short.
 
The frustrating part is that the stocks with really great risk/reward for shorting quickly have their borrows eaten up by the most attentive traders. Since locates can often become available intraday, you pretty much have to have your eyes on the column at all times if you want those shares. Unless you can devote the screen real estate to have the column visible throughout the day, you'll likely miss some good opportunities.

Luckily there are some other options. The easiest is to just set a GTC order below the best bid so that when shares do become available, you'll get executed. At least theoretically. In practice, that doesn't always work. Day orders actually seem to have priority so you might just use a GTC order to remind yourself to set a day order below the bid every morning. Just be prepared to have both orders execute if lots of shares become available and your GTC order is in range of the stock price.

Even better though, are audio alerts when the stock becomes shortable. That way you don't even have to be at your computer to quickly learn of new borrows on a stock you're watching. I only figured out how to do this yesterday and I'm curious how many other people have figured it out. For now though I'm keeping it to myself because it just seems like too valuable of an edge to give out for free.

Wednesday, May 16, 2012

Review: PennyStocking DVD

This DVD offers the basics of not just Tim's strategy, but also the basics of how penny stocks trade in the bigger picture, which makes this DVD uniquely helpful to people who are just starting out trading. Considering this, I would recommend this DVD to those people who don't have much experience with trading and aren't familiar with the nitty-gritty of trading.

Potentially the most helpful part of this DVD is the overview of the most relevant technical analysis. The reason I like these sorts of DVD as opposed to some of Tim's recorded seminars that are then recycled as DVD's, is that you get to see example after example of stock chart along with the technical indicators that can tip you off to how to trade it. Since the patterns don't change from pump to pump, these examples are extremely useful to see and absorb into your mind.

Of course the downfall is that stock charts are always viewed in retrospect. Regardless, Tim does a good job of identifying the sort of patterns that occur BEFORE big moves, thus allowing you to learn and profit from current pumps. What's nice is that he is very aware of this problem and even includes some charts that don't include the big moves so you get a sense of exactly what you would be seeing if the stock were trading today.

If on the other hand you've been trading for a while already, you might prefer something like Best of LiveStock, since it skips the more basic and general trading orientation, instead concentrating on Tim's short-selling strategy itself.

There is also some interesting but useless stuff like advertising of Tim's book and how he published it.

Saturday, May 5, 2012

Review: TimFundamentals Part Deux

This DVD is like paying 400 dollars to watch a worse version of the first TimFundamentals. I was extremely disappointed in this DVD as it does not feel instructional. It is another recording of a live seminar which I really don't like because the presentation is designed for the people who were there and not for you as the video viewer. Throughout the DVD you cannot hear the comments of the audience as they ask questions, make comments etc. Worse still, Tim sits far away from the mic for a good portion of the video which is quite frustrating because even on max volume on my computer, it's tough to hear at times. It's not like you can't hear him though so it's not the end of the world.

I was surprised to find this quote in there: "According to covester I should go all in. Remember that." I'm not sure why he would have said something that contradicts his own rules but I guess that is just a reflection of the lesser quality of this DVD.

The latter part of the DVD is better as it involves live trading so you get a sense of Tim's thought process but throughout the DVD I never really felt like I was learning anything I didn't already know.

One fleeting example of the value in this DVD is exemplified in the quote, "Yesterday is the best indicator of today." Feel free to send me your $400 dollars for that piece of advice.

Tim is a much better teacher than this DVD puts forth. I encourage people to check out some of this other DVDs and just steer clear of this one.

Review: BigCharts.com

There's a reason I use BigCharts more than any other web-based charting service. The charts may not be very pretty, but they are extremely clear and the limited number of options makes navigating those options quick and painless. Since I don't rely on any indicators other than price action and volume, BigCharts gives me everything I want and strips away everything else I don't want. What more could I ask for?

Review: StockCharts.com


The problem I have with stockcharts.com is that it has more than I want. I know that sounds kind of strange but it just takes away the practicality for me. When I want a detailed chart with lots of options, I would use my trading software, not the internet. It's faster and you can save what you're looking at as well as draw lines etc. Thus, a feature loaded chart it not what I look for in an internet charting website.

If I want a simple easy to read chart I prefer BigCharts.com. It is less elegant but it has everything I want and nothing more. So really I don't have much to complain about shockcharts but it just doesn't come in very useful to me.

Wednesday, April 18, 2012

SNPK: What Happened And What Next?

Update: I'm declaring SNPK a worthless buy once again. It would make a good short but there have never been shares available to short this whole pump and I see no reason to expect them to become available. Looking forward to the next pump.

Original Post: -----

If you're reading this post, chances are you lost money and are searching for some reason as to why your investment went bad. First off, I'm sorry for your loss. Hopefully I can help prevent such a loss from happening in the future.

What Happened?

To understand this, we need some background. SNPK was being promoted by a group of promoters that are paid to artificially inflate the stock price up. If you found SNPK through some sort of advertisement or email, these are the people who are inflating the price. The promoters job is to generate hype around the stock, sending out thousands of emails a day, telling people how great the stock is. Presumably you were one of those people who was fooled into believing the emails and their $9 price target.

Promoters can also use other tools of varying legality in order to make their featured stock gain in price. Often times it seems as though certain market makers will have a hand in the promotion by putting in huge bids to support the price at unnatural levels. When people see that support, they buy and the price moves up. The artificial support moves up and the cycle then continues until the price is way higher than it deserves to be.

Why would people promote a stock just to crash it later? It's usually unclear who actually paid the promoters and frankly it doesn't really matter. You can usually check the bottom of all emails for a disclaimer to discover an idea of who paid and how much they paid. Here is an example disclaimer from the latest SNPK email:

Check out that last paragraph. This particular promoter group was paid $50,000 dollars to send you an email reassuring you that SNPK will recover. Wouldn't you say that makes them rather biased? Also if the stock crashed 50+% while they were saying how great it is, you probably shouldn't trust anything they say anymore.

Also, the promoters are composed of a vast number of sister sites/organizations so that they can split up the amount of money they have been compensated, thus making them look less biased. I don't remember the exact amount that APS/CrazyPenny was compensated for pumping SNPK but is somewhere around 1 million dollars.

If you are still wondering why people would be evil enough to inflate a stock and then drop it so that normal people like yourself end up losing lots of money, the motivation is the same as many other evil acts: money. Imagine you have a large sum of money and you want to make lots more money with no regard for morality or your fellow human beings. So you buy a million dollars worth of SNPK at 0.28, then spend another million dollars on the promotion. You then sell your million dollars worth of shares at 2.30 just before the drop to make a profit of around 7 million. This is the sort of strategy that fuels the immoral promotional campaigns.

What Now?

Unfortunately, if you've just discovered your loss and are wondering if you should sell and take your losses or wait in the hope that it will rebound as the emails promise (the same emails that originally tricked you), I am going to have to suggest that you sell. Based on previous promotions, there is some possibility of a bounce, but even then it probably won't be by much. The greater chance is that the price will drop even more and over the next month or two, SNPK will be trending down to below 28 cents per share.

I Want My Money Back

Hopefully I can offer some guidance for how to profit from these kind of crashes rather than falling victim to their dishonesty. The key to this is shorting. If you're reading this, you probably don't understand shorting and/or have heard terrible things about it. The truth is, that shorting is just like regular trading but with the opposite goal. Thus, when a stock crashes hard, you make money. Due to the large amount of misinformation about short selling, I invite you to do several google searches about it before coming to a conclusion. Some people even say that it is illegal but that is false. If you'd like to start identifying sketchy stocks and make money from them, I suggest you check out all that profit.ly and friends has to offer.

Coping with the current loss
Big losses are devastating to your confidence both in and outside of the stock market. You don't want to make the same mistake again and next time you want to know how to make money from these sorts of events rather than losing. Hopefully I can help you with these goals.

The important thing to do is to take a break from trading. You will naturally want to regain your losses and it is likely that you will end up making trades with poor risk/reward ratios while trying to do so. By doing this, you will only make things worse and end up losing even more money. Come back to trading when you've calmed down and had a chance to relax. If you trade with the mindset of "I need to make this money," then you're probably going to trade poorly.


Review: Shortstocking DVD

This DVD is very well organized and I think covers everything you need to know about short selling. Everything from the basics to what to look for in chart patterns is covered in detail. Some of Tim's DVD's can seem like a long rant that touches on the topic at hand but this DVD actually presents more as an structured lesson which is nice.

I think I would only recommend this to people starting out with Tim's strategy since if you've been following it already, you already know what shorting is, and how to do it. The strategy for shorting is definitely covered in this DVD but it would just make more sense to buy a DVD that focuses on the strategy if you're already comfortable with shorting.

That being said, if you want to get a better handle on how shorting works, or you want to revisit the fundamentals, this DVD is a good choice.

Saturday, April 14, 2012

Review: TIMtactics DVD

Only good if you're just starting out.

This DVD was just a recorded webinar and I think that takes away from the value of the content. It is structured for the people who paid for the webinar and not necessarily for the people who buy the DVD later.

Most of the lessons contained in the DVD are basic so it wouldn't be worth it to buy this unless you're unfamiliar with Tim's strategy. The parts that should be useful, when he goes over stocks he has traded in the past, seem obvious. At several points he shows a supernova chart and the lessons are things like, "You can actually make money on the upside, if you buy this early." Such a lesson is obvious in retrospect when you can see the chart. The lessons should really be focused on how to identify charts that could supernova and what the indicators are for when there is more upside. I just didn't that sort of information in this DVD as much as I have in Tim's others.

It almost feels like this is 5 hours of explaining what Tim's strategy is, and less about how to do it yourself. There is no live trading which I think would have been a big help. I was just pretty disappointed.

Sunday, April 8, 2012

Review: Interactive Brokers

When I originally reviewed Interactive Brokers on Investimonials, I summarized them as "an unfortunate necessity for pennystocking." The rest of that review is as follows:

I recently switched to IB and made my first few trades. I have to say, I hate all of the interfaces they offer including the website. Everything just feels bulky and overwhelming when it doesn't need to be. I can't even bare to deal with their software so I still use TOS's software to watch my stocks. So even though I'm far from thrilled with them, I can't really do any better for shorting microcaps especially for the account size that I have (small). Even though the minimum is usually 10k, I think the minimum is only 3k for those 21 and younger so keep that in mind if that applies to you.

I would like to amend my review to add that I have never had any problems with Interactive Brokers and although all of my previous complaints still hold true, they are minor compared to the utility IB provides in playing penny stocks. No other broker I have thus far encountered has allowed such a great ability to find borrows on these microcaps and with relative ease. There is no need to contact anyone to ask for borrows which is nice and the website allows for the availability of shorts to be searched here. Considering this, I would certainly recommend to anyone hoping to get started playing penny stocks to open an account here and try them out.

If you'd like me to refer you so you can try them out, send your full name to promopennygather at gmail dot com. I get a lot of email so if you don't get a response within 48 hours, feel free to send it again.

Thursday, April 5, 2012

Tracking Penny Stock Pumps: Customization

To track all of the latest penny stock pumps, it is best to create a new email account and sign up to all of the known pumper's email lists. The problem with this is that your inbox quickly becomes cluttered and confusing as you receive tens of emails a day. In order for this to be useful, you need to keep track of which pumpers are worth keeping a close eye on, and doing so is made more difficult by all of this clutter. This guide will help you with the customization of gmail so that you can more easily track and organize all incoming pumps.

This guide will be most useful for those of you who don't already have a dedicated email address for all of the pump websites. Alternatively, you can unsubscribe and subsequently resubscribe to all of your lists if you choose to implement this strategy.

The method relies on the fact that you can add tags onto the end of your email address. For example, if your email address is pumptracker@gmail.com, then typing pumptracker+AwesomePennyStocks@gmail.com is the functional equivalent. Both of the above addresses will route to the same inbox. So how is this useful? Gmail's ability to filter emails.


From gmail's landing page, select settings and choose the tab "Filters." Click create a new filter and add your tagged email address to the "To" category. Then choose "create filter with this search" at the bottom. Now select the checkbox "Apply the label" and choose the appropriate label. I suggest you create labels for each major pumper you want to track and label them that way.

To apply this strategy, you will want to go to each major pumpers website and give them a tagged email address. So if you are at APS's website, you will sign up to their newsletter with youremail+AwesomePennyStocks@gmail.com. Then at a BDPS website you might add youremail+BDPS@gmail.com. Just keep in mind that for this to work properly, you must type the exact same email for the newsletter signup as you do for the filter. If you forget exactly what tag you used when signing up though, you can always check the emails they send you, as the header To: will contain the email+tag you used when signing up.


Now your emails will automatically be filtered into their respective labels as they arrive and you can easily tell which pumpers are pumping which stock. This makes it much easier to track one particular pumper if you are expecting a big release from them one day.

Sunday, March 25, 2012

Review: The Black Swan: The Impact of the Highly Improbable

This book, by Nassim Nicholas Taleb, was very entertaining and definitely influenced my way of thinking. That being said, the whole work was not completely relevant to trading and where it was, it tended to be redundant. The whole book can probably be boiled down to the single lesson of keeping an open mind. The difference though is that this one lesson that I'm sure everyone has heard, is now being framed in the context of probability which is what makes this book unique.

I would definitely recommend reading this but it is probably best suited to the coffee table rather than your bookshelf of trading materials. The author himself is, or rather was, a trader though so it's not as if the book never relates the ideas back to trading. It does on occasion but the lessons are so broad that they aren't really able to be applied to single trades. Rather, the hope is that you will alter your mindset so as to trade more carefully and understand the influence of what seems highly unlikely.

Review: Profit.ly

I think profit.ly's greatest attribute is that it provides a well laid out design that lets you keep track of your own trades. The innovation comes with the community surrounding profit.ly although I find this aspect still very much in the development phase in terms of reaching a greater purpose. It might be mildly interesting to see what people have been trading in the past but ultimately it usually isn't helpful.

I think one of the motivations of the site is for Tim Sykes to advertise the gains of his subscribers, which I certainly don't blame him for and its a perfectly fine motivation to have. The problem is just that there is so much more potential for the site and the concept that I can only hope is being worked towards. Rather than just be a site for Tim's followers, it needs to be a site for the average trader and I just don't see a whole lot of appeal for them right now. Furthermore, one of the great flaws is that people can post fake trades if they choose to do so which may be motivated by a desire to get a pat on the back from Tim.

I have actually found profit.ly useful during tax season though because it gives me a general sense of my P&L as well as the time-frame of my trades. If you submit all of your trades you can use profit.ly just to double check your filings to make sure there are no major discrepancies. Unfortunately, profit.ly isn't flawless yet so you can't actually use it as a surefire method of tracking trades for tax purposes, but it's user friendly design certainly lends a helping hand when doing so.

Some quick suggestions: Perhaps require a certain percentage of reported trades to be verified? Have certain benchmarks of verified trades trigger a free 24 hours of the premium stats on Profit.ly?

In order to make the community aspect more useful, there should be a way to encourage helpful hints. The best trade posts include comments that explain why the trader went in and out. Maybe feature such helpful posts somewhere on the site, or allow people to vote posts as helpful to create a new category of ranking?